Unified dashboard
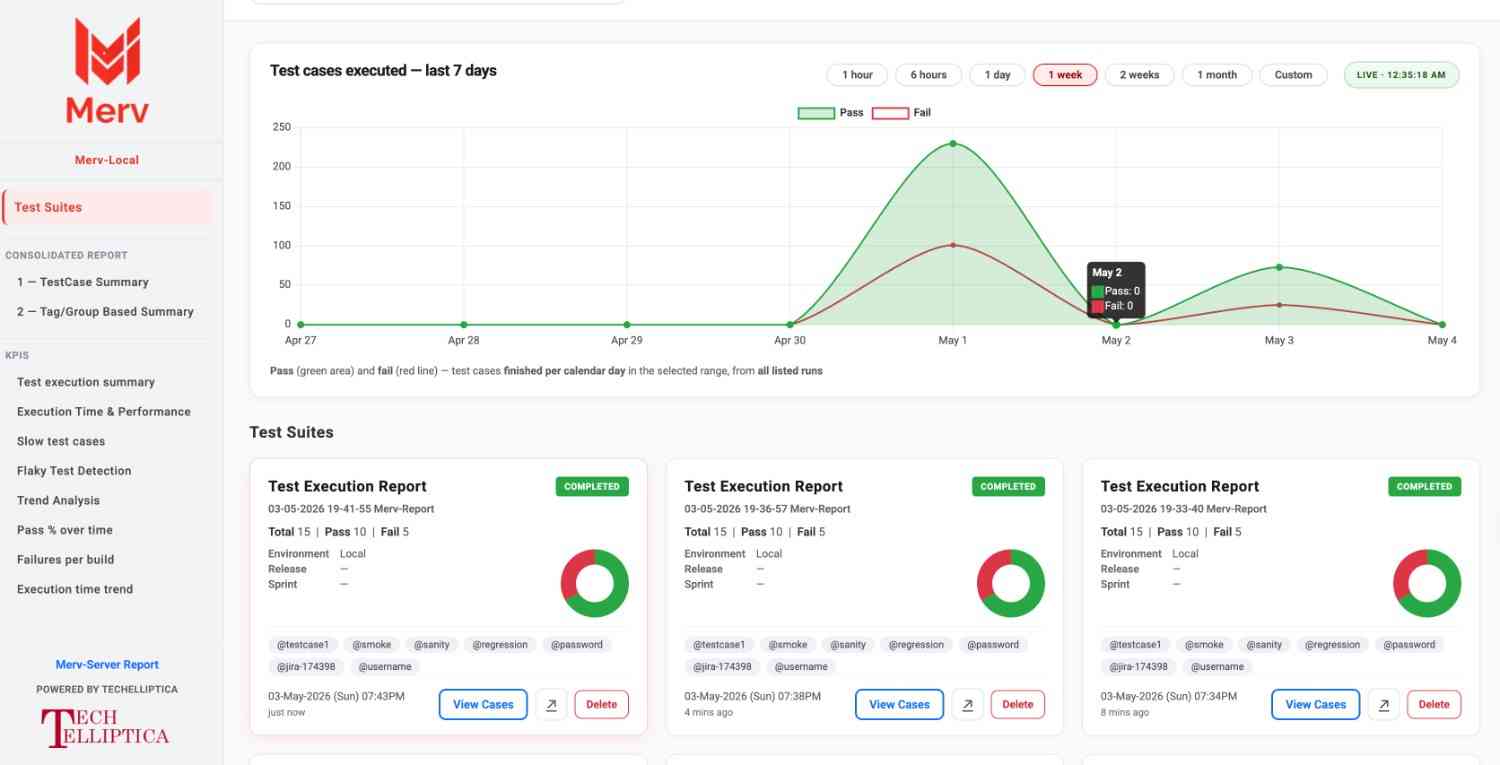
Every run as a suite card — pass, fail, skip counts, tags, environment meta, and live in-progress badges.

Merv-Local 4.0.23 · Merv-Server
|
|
Why teams use MERV
MERV (Metrics Engine for Reports & Visualization) is centralized realtime test reporting and logging visualization
for development and automation teams — one place to see every suite, testcase, step, screenshot, and KPI instead of scattered logs and
one-off HTML files. Whether reports stay on disk (Merv-Local) or sync to the cloud
(Merv-Server), the same merv-client integration gives your team a
single reporting model.
Connect Cucumber, TestNG, JUnit 5, Playwright, or Cucumber-js once. Browse runs on a live dashboard, compare history in a consolidated view, triage failures, track pass rate and duration trends, and spot flaky tests — from your laptop or CI, local or server.
Every run as a suite card — pass, fail, skip counts, tags, environment meta, and live in-progress badges.
Time-series of pass/fail completions across runs while tests execute — no waiting for the job to finish.
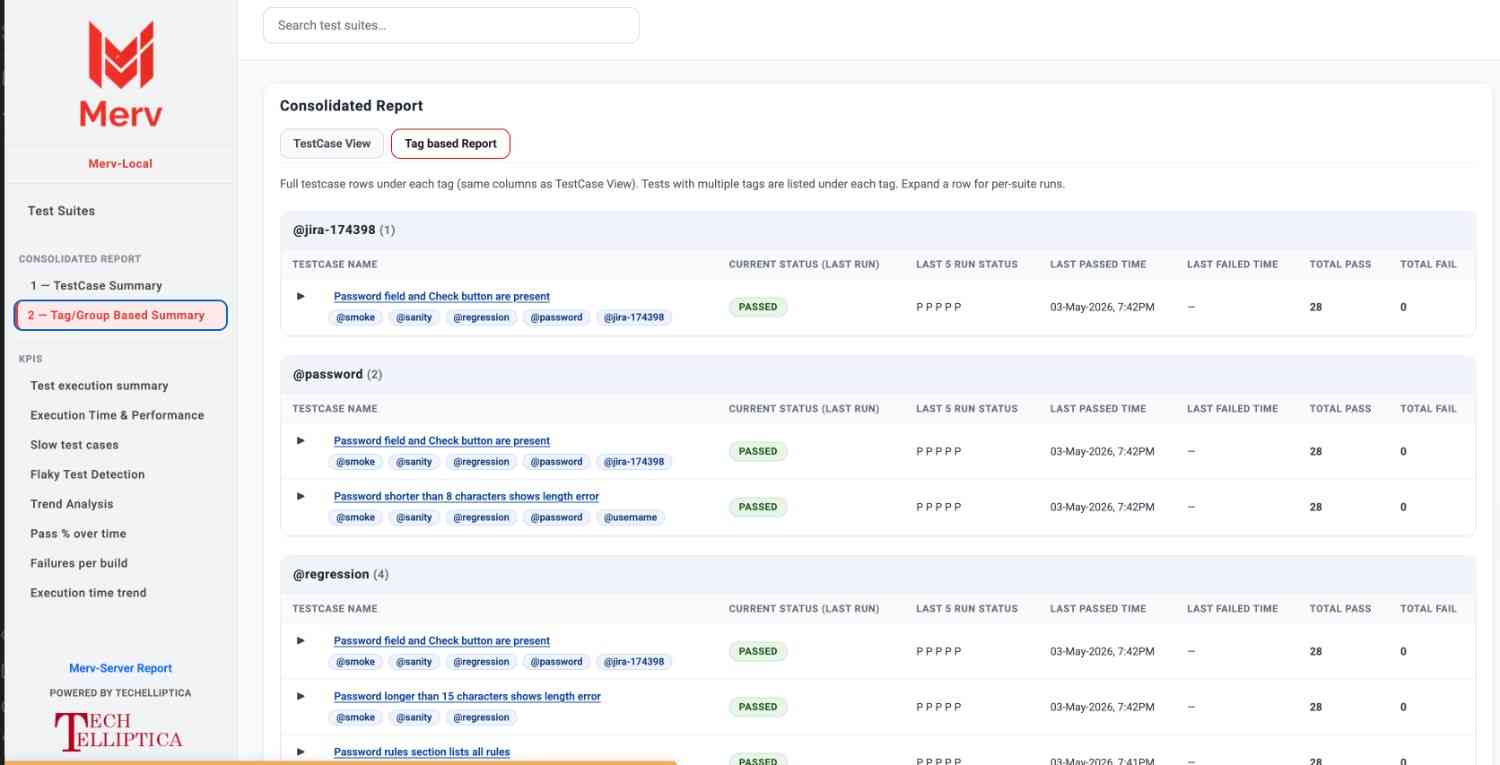
Testcase status across all runs: last five results, last passed/failed, tag groups, and current failure summary.
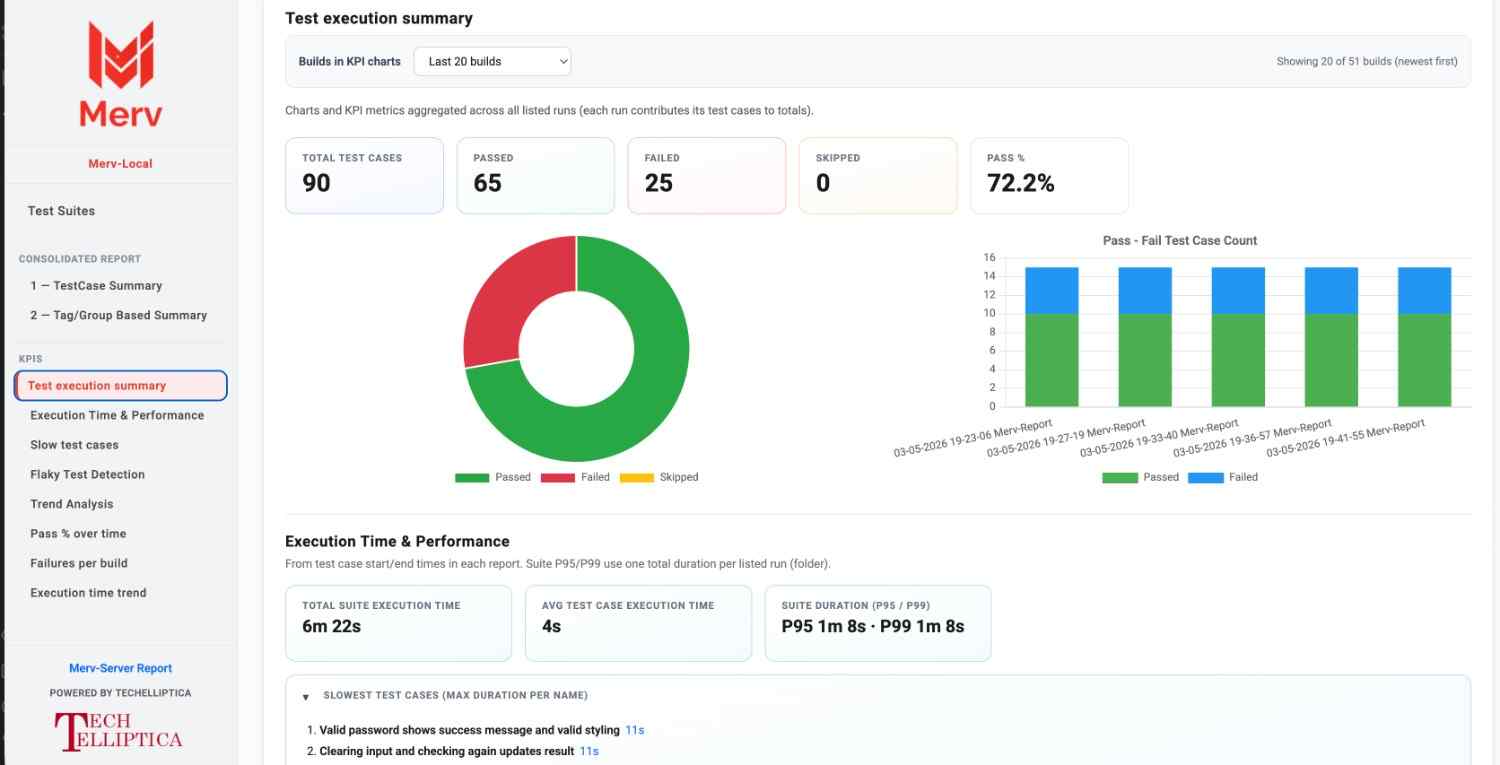
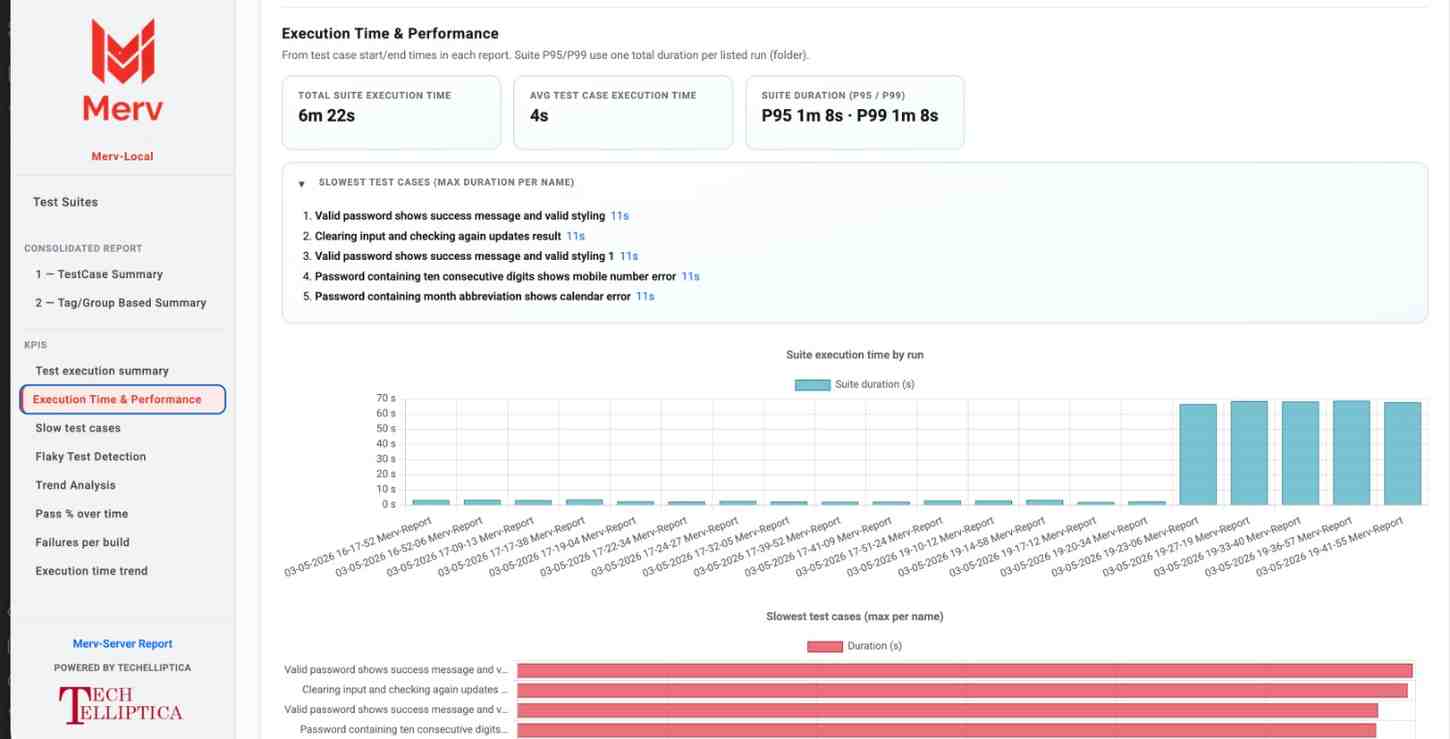
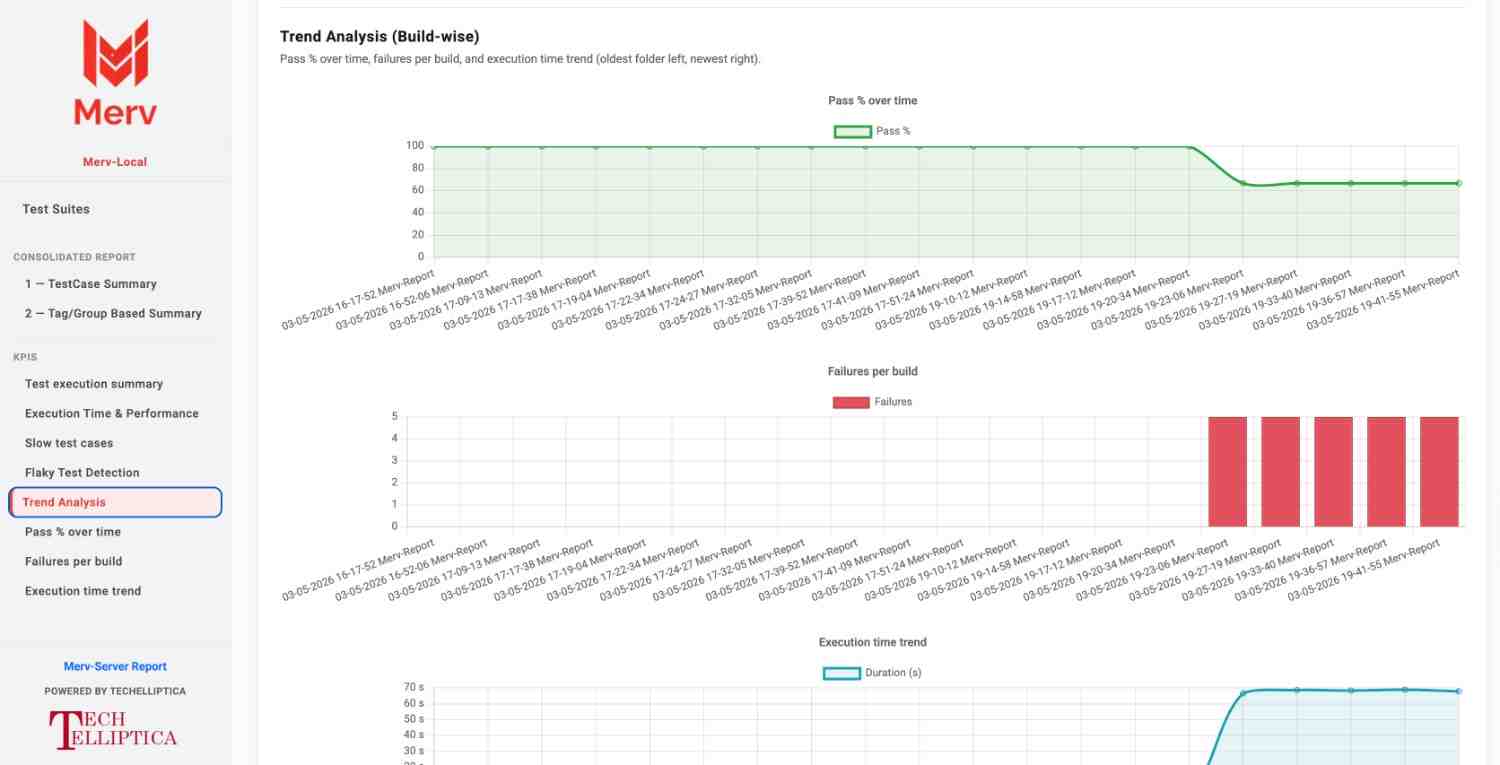
Pass %, doughnut and stacked bar charts, suite duration P95/P99, slowest cases, and build-wise trend lines.
Tests that both pass and fail in scope — stability score, flip counts, and failed-run history.
Pull logs from Spring Boot, SLF4J, Log4j, Playwright, and other tools into one Merv-Logs view — filter by project, level, and suite on disk.
Filter and summarize by @smoke, @regression, browser tags, and custom scenario tags.
Same merv.properties toggle: rich HTML on disk, or push suites to merv.online/app for the team.
Scaffold or heal merv.properties, Maven dependency, and Spring Boot logback-spring.xml with merv-client doctor setup / setup-log.
Route System.out, SLF4J, Log4j, and console.* into Merv-Logs with doctor set console and MervLogAppender — idempotent, reversible with unset.
Run small JS/TS files with npx merv-tutor, then npx merv-tutor open to step line-by-line with source on one side and live variables on the other.
Multi-file project traces, console mirror, and complexity hints under merv-reports/merv-tutor/ — built for lessons and debugging, not suite noise.
Real screenshots from a sample Merv-Local run — the same views you get on disk or after ZIP import on Merv-Server. Open the sample report →
Merv-Local is centralized reporting on your machine —
no account or server required. Connect your test framework via merv-client; each run writes JSON and
HTML under merv.report.folder. Open index.html through a local web server to browse
every run, live suite status, consolidated history, and KPIs.
While tests execute, open live suite HTML that polls report data in place. When the run finishes,
use the dashboard to compare builds, spot flaky tests, triage failures, and export
merv-report-upload.zip for Merv-Server import.
Merv-Server is centralized reporting in the cloud - create an account, set up workspace and projects, add merv.properties with merv.local=false, and your automation
sends suites, cases, and steps to MERV — no merv-reports/ folder on every machine.
Account → workspace → Hierarchy ID → API key → run tests. Results appear at
https://merv.online/app for your team — share a link instead of zipping local HTML.
Merv-Server
Merv-Doctor is the setup and healing CLI built into
merv-client. One command scaffolds or repairs MERV wiring in your project —
without rewriting your existing settings.
Use it for Java/Maven and Spring Boot apps, or JS/TS packages: create merv.properties,
add the dependency, wire Logback / console into Merv-Logs, and keep everything
idempotent so re-running doctor is safe.
doctor setup / setup-log instead of hand-editing configsmerv.* properties; never overwrites yourslogback-spring.xml with MervLogbackAppender when detecteddoctor set console routes System.out, SLF4J, Log4j, and console.* into Merv-Logsdoctor unset console removes doctor-managed wiring cleanly./merv-client doctor … (Java) or npx merv-client doctor … (JS)# Java / Maven / Spring Boot
./merv-client doctor setup
./merv-client doctor setup-log
./merv-client doctor set console
# JavaScript / TypeScript
npx merv-client doctor setup-log
npx merv-client doctor set console
npx merv-client doctor unset consoleMerv-Tutor is a line-by-line step debugger for small JavaScript and TypeScript files — built for teaching, learning, and inspecting runtime behavior without mixing noise into Playwright or Cucumber suite reports.
Run a script with npx merv-tutor, then open the debugger with
npx merv-tutor open. You get source on one side, variables in scope on the other,
plus mirrored console output — all under merv-reports/merv-tutor/.
console.log still prints and is mirrored in the tutor UImerv-tutor.html and latest.json.ts directly; esbuild compile then Babel instrumentationMerv-Tutor debugger
npx merv-tutor lesson.js then open
Merv-Local writes json/merv-report.json and HTML under
merv.report.folder. Merv-Server stores suites on cloud and shows them in the
Merv App. Toggle with merv.local in merv.properties.
Central API + web UI: projects, test suites, testcase management, dashboard KPIs, API keys,
and upload of merv-report-upload.zip from local runs.
https://merv.online/appmerv.parent_hierarchymerv.propertiesSuite pages, KPI panels, consolidated tables, and the live execution chart — carousel shows real Merv-Local screenshots from a sample run.
The default dashboard lists every run folder as a card and shows a live execution chart at the top. Search filters cards by folder name, suite title, and tags.
Merv provides a time series for pass (green) and fail (red) completions per minute across listed runs.
One Execution Suite per run folder, built realtime in execution so no need to wait to finish your execution.
Based on the local execution, Merv provides a consolidated report with different analysis and views.
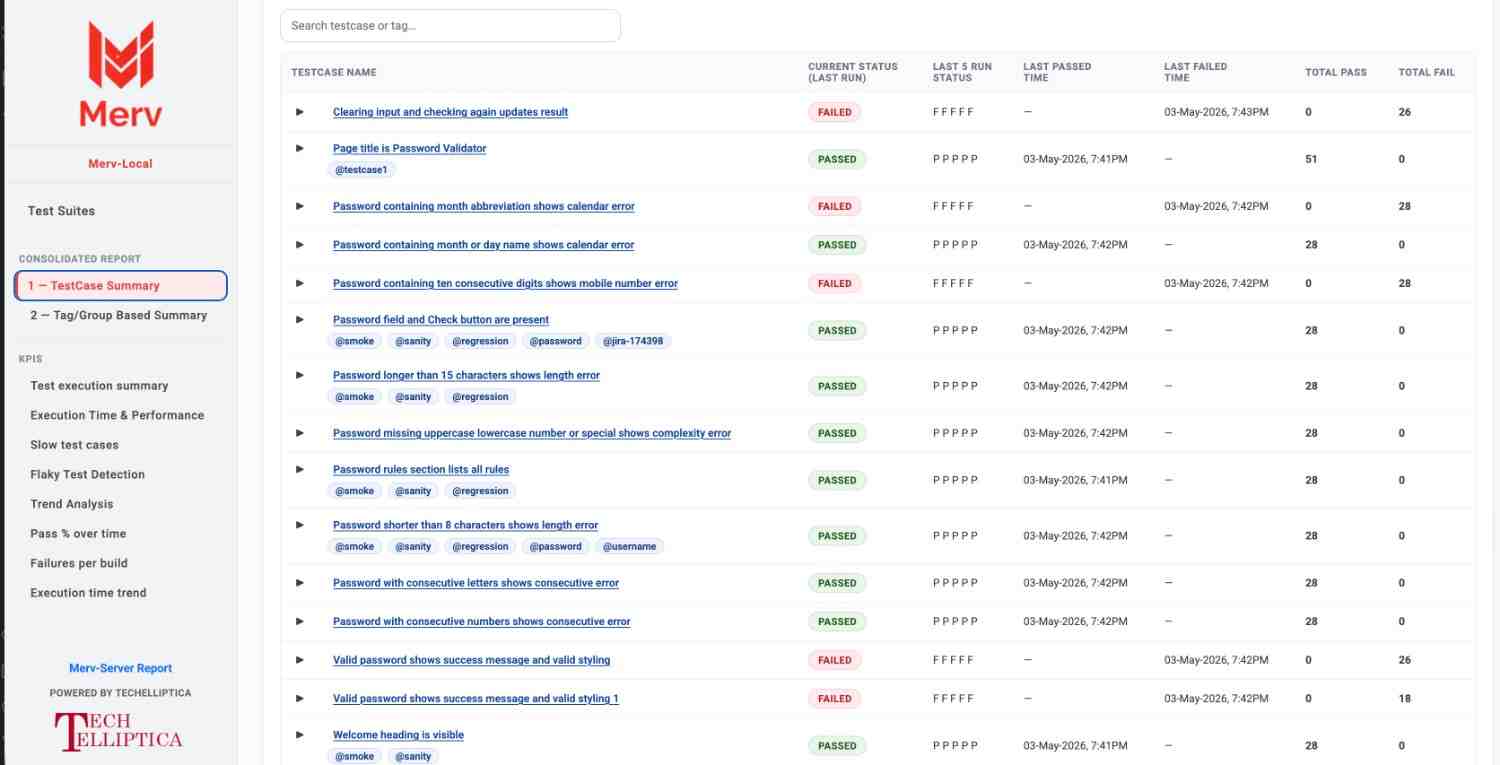
merv.regression_suite; one row per testcase with latest statusGroups cases by scenario tags (e.g. @smoke). Multi-tag scenarios appear under each tag.
Current failures only — latest failure reason per testcase; rows drop when the test passes again.
Merv provides a set of KPIs to help you understand the execution and performance of your test suite.
Tests that both passed and failed in scope: failed-run count, passed-run count, stability, and pass/fail flips.
merv-report-live.html — live suite while tests runmerv-report.html — final suite with steps and screenshotsMervReporterQA engineers, developers, and release owners who want centralized visibility into test runs — live progress, historical comparison, and actionable KPIs — on disk with Merv-Local or in the cloud with Merv-Server.
MERV is built by the team at TechElliptica. Connect with us on LinkedIn.
Choose Merv-Local for on-disk HTML, or Merv-Server to send reports to the cloud — account, API key, and merv.local=false.